Grails Google Chart API Plugin
Since it was announced several days ago, I've been messing around with Google Chart API and Grails plugins.
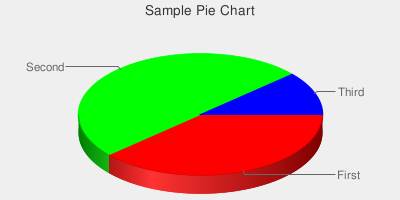
Here's an example of the code to produce a pie chart:
    def labels = ['First','Second','Third']
    def colors = ['FF0000','00ff00','0000ff']
    def values = [35,45,10]
It produces the image tag:
<img src="http://chart.apis.google.com/chart?chs=400x200&chd=s:v9O&chl=First|Second|Third'
  &chco=FF0000,00ff00,0000ff&chf=bg,s,efefef&chtt=Sample Pie Chart&cht=p3" />
That code produces the following pie chart:

Download: Redacted due to age of post Now available in the Grails Plugin Repository ...install with:
grails install-plugin google-chart
As with the social bookmarks plugin, there are more extensive examples in the plugin itself. Run it with grails run-app to see them. Some of the advanced features aren't implemented yet like item markers and the like but you are able to use any of the three types of encoding, multiple datasets, all chart types and axis labeling.
Because of the 1,000 call threshold imposed by Google, unless you want to risk your charts not showing up, it wouldn't be a good idea to use this on a high traffic site since it does a straight call. The next evolution will probably be some sort of caching mechanism based on the dataset, other attributes, or something.
Edit: It's actually 50,000 calls per day.
Let me know what y'all think..